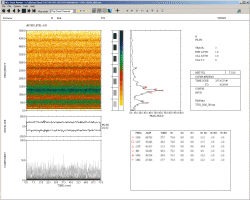
DataViewer Analysis System
An application for viewing and analysing processed dynamic data interactivelySupports both time and frequency domains
Interactive viewing and interrogation
Cursor interrogation support
Order and mode tracking
Data validation
Multi-function plot types
User-definable colour maps
Cross-spectral analysis on complex data
Cycle counting analysis on time history data
Worldwide connectivity
Overview
The DataViewer is an application for viewing and analysing processed dynamic data interactively. It can be used to view either time-domain or frequency-domain calibrated data. Features include placing cross-hair cursors on the screen, toggling the display between different channels, or replaying the data to simulate live capture.
One of the DataViewer’s main features is the flexibility of its plot types. The main screen of the application consists of a number of different plots. These plots are all derived from the same data, and they present various aspects of the data in different ways. HGL Dynamics can provide additional plot formats if required for specific applications.
The standard output types include:
Spectral Density and Waterfall Plots
Time History Plot
Amplitude Envelope und Spectrum Plot
Spectral Peak-Hold Plot
Reference Peak-Hold / Spectral Component Plot
Shaft Speed vs. Time Plot


